Irene Nafula·Jan 7What to Do First When You Open a New DatasetIf you’ve ever opened a new dataset and felt overwhelmed, confused, or tempted to jump straight into charts and queries, you’re not alone…
InThe Data GazettebyIrene Nafula·Nov 11, 2025How I Identified the Most Recent Golden Cross for the S&P 500 ETF (SPY) using Alteryx DesignerThis month’s #DataDrillChallenge from Maven Analytics was all about spotting Golden Crosses in SPY (S&P 500 ETF) price data. These are key…
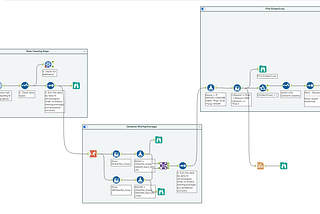
InThe Data GazettebyIrene Nafula·Sep 1, 2024Generate a real-world dataset using Python & insert into a databaseEver stared at a mountain of csv files and thought, ‘How on earth am I going to get this into a database?’A response icon1A response icon1
InThe Data GazettebyIrene Nafula·Aug 21, 202410 Best Practices for Writing SQL QueriesWrite SQL like you mean it — clean, readable and efficient.
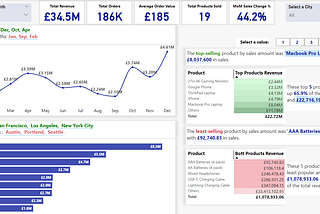
InThe Data GazettebyIrene Nafula·Aug 7, 2024Sales Analysis in SQL Server & PowerBI -Part 2In part 1 of this project, we created our database from a backup file and then connected it to PowerBI for cleaning. If you prefer to…
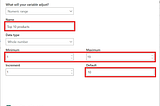
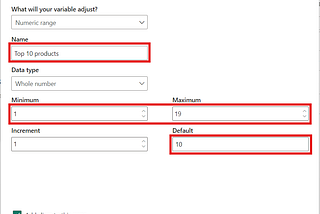
InThe Data GazettebyIrene Nafula·Aug 2, 2024How to create a Top N visual using Numeric Range parameters in PowerBIAssuming we have a products table in PowerBI and we would like to create a bar chart that shows the top 10 products by sales revenue.
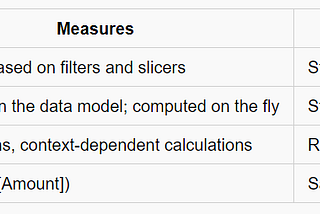
InThe Data GazettebyIrene Nafula·Jul 6, 2024Measures vs Calculated Columns in PowerBIIn PowerBI, one of the most common confusions users have is between measures and calculated columns. They might seem similar at first…
InThe Data GazettebyIrene Nafula·Jun 24, 2024Sales Analysis in SQL Server & PowerBI -Part 1This project involves 2019 sales data from a data analytics challenge I participated in. We will restore a backup file in Microsoft SQL…